Some facts, assumptions and calculations on App Store & Google Play
In 2013, 6.1% of all app downloads (approx. 80bn apps) from all application platforms will be paid. (Juniper, July 2013). Thus 4.88bn app downloads will be paid. Assuming that the share of paid downloads is higher in the App Store than in Google Play, I add some percentage to the 6.1% for Apple, leading me to 8% for paid downloads in the App Store. I assume this figure has only slightly come down since 2012, as in proportion more free apps than paid apps have be added to the App Store since 2012.
App Store downloads in 2012: 20bn
App Store revenue in 2012: US$ 8-9bn (Forbes, January 2013)
More stats on paid apps revenue
Apple payout to app developers 2012: USD5bn (WDC, 10 June 2013)
= average payout per downloaded paid app in 2012: approx. USD 3.13 (5bn/1.6bn paid downloads [20bn*8%])
= average app price per downloaded paid app in 2012: approx. USD 4.46 (3.13 /7*10)
Google Play downloads in 2012: approx. 20bn
Google Play revenue in 2012: approx. US$ 1bn
Google Play Revenue statistics

Total revenue of App Store and Google Play (Distimo, April 2013)
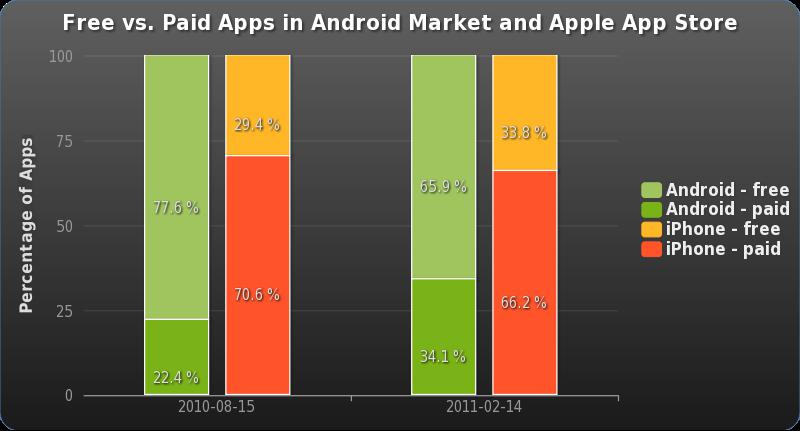
As the chart above shows, approximately 66% of apps in Google Play were free in 2011, while in App Store only ~34% of the apps were free. More than 95% of paid apps in Google Play costed less than $10 in 2011. Most Google Play apps were priced at $2.99 or less (73%) (Lookout Mobile Security, App Genome Report 2011)
iTunes accounts:
May 2012: 400m (asymco.com, June 2012)
Jun 2013: 575m (WDC, 10 June 2013)
Apple Store revenue distribution model 2013:
30% goes to Apple
70% goes to developer
Google Play revenue distribution model (2013):
5% goes to Google
25% goes to network carrier
70% goes to developer
App Store’s and Google Play’s revenue development 2012
App Store analytics company Adeven says two third (65%) of all apps in the App Store are next-to-never downloaded (Adeven.com, June 2013).
60% of all the apps in the App Store have never been downloaded (Adeven.com, August 2012).